
Don’t know how to interpret the Google Analytics (GA) funnel visualization report? Fret not because you are not alone. It took me a while to understand it, and the good news is I feel I get it enough to put my two cents. Read on.
First Step as Required in Google Analytics Funnel Visualization
When creating a funnel for a destination goal, you have an option to make the first step of the funnel required:

Should you set the first step of your Google Analytics goal funnel as required? In short, you probably should not unless you want to know the role of a particular funnel step.
By enabling that toggle, you tell the report to include only those sessions that had a visit to that required funnel step. All the other sessions that got into the checkout funnel but did not include a visit to the URL you mark as required are excluded. And that leads to all sorts of implications. Let’s look at a couple of them:
Funnel conversion rate
Funnel conversion rate is a percentage of sessions that got into the checkout funnel you defined (the total number of funnel entrances) and converted (reached the destination goal URL). Google Analytics calculates it using the following formula:
Funnel conversion rate = (*funnel conversions / sessions that got into the funnel) * 100
*Here, the funnel conversions (aka funnel completions) are the number you see in the last funnel step box instead of the overall goal completions you might see in the Goals Overview report. The funnel conversions will almost always equal to goal completions provided that:
- We are talking about the same goal in both reports
- The 1st funnel step is optional
- The data range is identical for both reports

When you make the first funnel step required, you tell Google Analytics to skip sessions that do not include a pageview of that funnel step. That’s when the funnel completions and goal conversions might not match:

Note that the required funnel step can be at the beginning of the user’s path, in the middle, or at the end. Therefore, its position in the user journey through the funnel is not important.
Let’s say we want to visualize a funnel that consists of these steps:
- /cart
- /checkout/contact_information
- /checkout/shipping
- /checkout/processing
- /checkout/thank_you
What you see above is a typical checkout funnel of a Shopify store.
Some stores make it possible to complete a purchase without visiting the shopping cart (a user can skip the cart, or the cart functions as a flyout without generating a pageview). So, if the cart is your required step, you decrease one of the arguments of the above formula (sessions that got into the funnel), which directly affects the calculation of the funnel conversion rate:

Wonder why the funnel conversion rate is different from the e-commerce conversion rate? The standard e-commerce conversion rate is a percentage of sessions that lead to a conversion. Here are the numbers for this particular client for the same date range:
- The total number of sessions is 1280
- The total number of sessions that converted is 20
The e-commerce conversion rate = (20 * 100) / 1280. That brings us to an e-commerce conversion rate of 1.56%.
The e-commerce conversion rate is significantly lower than the funnel conversion rate. And it makes sense because the total number of sessions will almost always be greater than the number of qualifying funnel entrances. The exception is when one of your funnel steps matches any page URL, though I don’t see why you would do it.
Funnel entrance pages
To correctly interpret the funnel visualization report, you need to know how it works. This report does not reflect the actual user journey through your funnel. Instead, it merely assigns each defined funnel step the following numbers for every qualifying session (a session that includes at least one pageview of any defined funnel step):
- Unique pageviews of each visited funnel step
- Entrances into the funnel at each step
- Number of exits from each funnel step
The second item on the above list directly correlates with the required step setting. Why? Because the entrance to the funnel is always assigned to the step in the user's path that was highest in the funnel, even if the user entered lower in the funnel.
The Cart is the topmost funnel step in our sample funnel definition. Therefore, if you set it as required, the funnel visualization report will attribute all entrances into the funnel to that step, even if a qualifying session did not start at that funnel step.
Imagine a person visiting the site, adding products to their cart, but leaving without completing a purchase. The next day, they receive an abandoned cart email with a link that points directly to the checkout page (/checkout/contact_information). The person clicks on the link and is taken to the Checkout page, detouring the Cart. She then realizes she wants to change the quantity of a product and visits the shopping cart.
The following path represents the user’s actual path:
- /checkout/contact_information
- /cart
As you will remember, the first steps of our funnel definition look like this:
- /cart
- /checkout/contact_information
Setting /cart to required takes the credit away from /checkout/contact_information since every single session included in this report will always have a visit to the /cart. And since that funnel step is defined as the highest, it will always be marked as the entrance page. The required step setting “hides” all the other possible entrances into the funnel that would otherwise be visible in this report:

Note that the funnel to the left has all entrances assigned to the top step, the Cart (119), while the funnel to the right shows more entrances midways (6 and 1). The second funnel reveals that there are multiple ways how people enter the funnel - not just at the Cart level:
- Six people entered the funnel through /checkout/contact_information
- Another one entered the funnel through checkout/shipping
It is probably best not to set the first step of the funnel as required unless you want to see the active role of the step’s URL in leading users through the funnel (e.g., a landing page for a paid marketing campaign). For general purpose cart-to-order goals, though, I would not make the first funnel step required.
Another possible use case that comes to mind is the actual funnel visualization report testing. For example, say you don’t understand what a loopback is by reading the official Google doc. You could create a test goal and set your first funnel step handle to a value nobody else could navigate to:

Since I know that nobody else is likely to visit the /?tst, I will have the whole funnel report for myself for testing.
Note that the required step setting does not work retroactively. For example, I wanted to see funnel entrances for one of the accounts, and unfortunately, when creating the goal, I made the first funnel step required. As a result, I won’t see funnel entrances for the data collected at the lower steps.
While creating a destination goal with a funnel, you might be worried that incorrectly setting the funnel could somehow affect goal completions or goal conversion rate, metrics available in most standard Google Analytics reports. However, as long as the goal URL is the same, changes to goal funnel settings won’t affect those metrics:

The above screenshot shows the same number of goal completions (28) in two different reports:
- 28 goal completions in Acquisition > All Traffic > Channels
- 28 goal completions in the Goal Overview > Goal Option dropdown
Goal completions are the number of unique pageviews of the goal URL. If the goal URL for both goals is the same, the goal completions number will also be the same - irrespective of the funnel settings.
Funnel entrances - left side of the report.
Let’s break this report into three sections so that we can tackle them one at a time:
- Funnel entrances (left)
- Funnel or step hits (center)
- Funnel exits (right)

The only real benefit of the Funnel Entrances section, at least the way I see it, is in helping us understand:
- The total number of sessions that get into the funnel for the selected date range (funnel entrances)
- The midway funnel steps that serve as funnel entrances
The total number of sessions that got into the funnel
Let’s work by an example, something that few SERP listings ranking in Google’s top 10 had:

Note that the funnel conversion rate for the sample funnel above equals 15.73%.
The Funnel Entrances section uses bolded numbers for every funnel step to give you an idea of the total number of funnel entrances (or the total number of qualifying sessions). To get the total, add them all up:
162+9+1+2+3+1 = 178.
There were 178 entrances into the funnel for the date range selected. It is also the number of qualifying funnel sessions. Let’s ensure it matches Google’s funnel conversion rate of 15.73% (you can find it inside the box of the lowest funnel step):
(28 conversions / 178 qualifying sessions) * 100 = 15.73
As you can see, calculating the total number of funnel entrances is easy.
Midway funnel steps that serve as funnel entrances
Let me repeat one important rule:
The entrance to the funnel is always assigned to the step in the user's path that was highest in the funnel, even if the user actually entered lower in the funnel.
I intentionally made the words “the user’s path” italic. It is essential to get that part.
Let’s see which conclusions we can make based on our sample report:
Conclusion One. People entered our funnel at different steps.
I mean, that’s good to know, right? We see that apart from the Cart, they also used the following funnel steps (I will use the funnel step names):
- Contact info
- Shipping info
- Payment info
- Payment processing
- Place an order
Two last funnel steps might be unexpected, but there is an explanation. The site has multiple payment gateways (PayPal, Google Pay, Apple Pay, etc.) apart from the main one (Stripe). So, a person gets to the Payment info page, then selects an alternative payment gateway, is taken off the site to complete the purchase and is returned to the site at one of the last two funnel steps. The used payment solution is not on the Referral Exclusion List, so it expires the current session and starts a new one (campaign referral change is one of the three ways to end a session). The new session begins at the Payment processing or Place an order step, which is why we see those otherwise unexpected entrances. How is that for the explanation?
By looking at the funnel visualization report, you could say if the site offers alternative payment methods that take the user off the site, provided that the 1st funnel step is not required, and alternative payment gateways are not on the Referral Exclusion List.
Conclusion Two. The rest is pretty vague and useless?!
Let’s look at supposed entrances at the Cart step:

Can we be sure that the highlighted URLs entered the funnel through the Cart? I don’t think so because of this rule:
The entrance to the funnel is always assigned to the step in the user's path that was highest in the funnel, even if the user actually entered lower in the funnel.
Let’s imagine the following user path:
- Home visit
- Product details page with two CTA buttons: Add to Cart (Cart) OR Checkout Now (Contact info)
- The user skips the Cart by clicking directly on the Checkout Now button, which takes them to the Contact Info step of the funnel.
- The user then returns to the Cart because they need to update product quantity.
Google Analytics will assign entrance into the funnel to the topmost defined funnel step in the user’s path, which in our case was the Cart, even though they came through the Contact Info step!
So, just because Google shows two product URLs at the Cart step, it is not guaranteed that it was the Step they used to enter our funnel:

They might as well have entered the funnel at any other step defined lower, such as the Contact Info step.
Let’s look at entrances at the Contact Info step (highlighted below):

Keeping the same rule in mind, we can conclude that sessions with entrances at the Contact Info step did not have a shopping cart pageview; otherwise, GA would attribute them to the Cart step. Yet, there is still no guarantee that those users did not enter into the funnel at steps located below the Contact Info step, such as Shipping info, Payment, etc. For example, imagine a session with the following user journey:
- Abandoned cart email link click
- Payment info (a person is taken directly to the payment info page)
- Contact info (they had to go here because their contact info changed, and they want to update it)
- Shipping info (they double-checked their shipping info)
- Place an order (conversion took place)
Here, the user enters the funnel at the Payment Info step. Therefore, that step should get the credit for generating the entrance into the funnel. Yet, because the user also visited the Contact Info page (defined higher in the funnel), GA will attribute the entrance to the Contact Info step. And once again, all those URL entrances might have happened at steps closer to the bottom of the funnel. It does not mean they did, but they could.

Note that the (entrance) record in the highlight section means that the funnel step URL served as both funnel and site entrance (that is, it served as a landing page for your site):

As shown in the above screenshot, the Contact Info URL served as a landing page for the site five times.
Funnel exits - right side of the report.

To properly interpret exits at each funnel step, we need to talk about the following:
- Site (exit)’s
- Funnel step exists
- Loopbacks
To test the above concepts, I created a bunch of funnels with the first required funnel step named “Qualified entrance.” Here is how it looks in the funnel definition:

Here, the idea is to ensure that only my test session gets “visualized.” Doing so allows me to see how Google Analytics records each session into the funnel. Other funnels created for testing are pretty much the same, only with the first required step being slightly different:
- /?site_exit= - to test site exits
- /?funnel_exit= - to see funnel exits
- /?loopback_parent= - to see how loopbacks are treated
- and so on.
Site (exit)’s
A page someone uses to enter your site is called a landing page. For example, someone Googles “Los Angeles SEO” and clicks on one of the search result listings. The first page they use to enter the site is the landing page.
Once on the site, a person can view multiple pages (pageviews) and interact with the site’s elements (events). Every such site interaction sends a hit to the Google Analytics server. A series of such hits is called a session. The last page that sent a pageview hit to the Google Analytics server is the session’s exit page.
A session can have only one landing page and only one exit page. At times, the same page can be the site’s landing and exit page (a single-page session, which could be logged as a bounce, provided that there is no event hit following it with a nonInteraction field set to “false” or 0).
Imagine a session with the following hits in the sequence presented:
Page A > Page B > Play Video > Download Brochure > Page C
Pages A, B, and C send pageview hits, while two events in between are user interactions on page B that send event hits.
Page C sent the last pageview hit to the Google Analytics server. As such, Google Analytics assumes that our user left the site after visiting that page. Google Analytics calls that an exit page. In the Funnel Visualization report, that exit is denoted with the word “exit” put into brackets, like this: (exit).

My test session included the following page path:
- Qualifying entrance
- Contact info
Since there was no pageview hit following the Contact info step, Google Analytics assumes that I left the site at the Contact info step. Therefore, it assigns an (exit) to the Contact info step:

The Funnel Visualization report follows this rule when it comes to assigning both site and funnel exits:
The exit from the funnel is assigned to the step in the user's path that was lowest in the funnel, even if the user actually exited higher in the funnel.
Here the funnel exit attribution coincides with the actual user path. The user exited the site at the Contact info step, and the funnel report also assigns an exit to that step. Yet, if I were to visit those pages the other way around (first Contact info and then Qualified entrance), the report would still assign the exit to the Contact info since it is the lower in the funnel definition.
Just because the report assigns exit to the Contact info does not mean that the user actually left the site at that step. They might have also left it at any other higher-defined funnel step they took. The same concept applies to both site and funnel exits.
I did another test just to confirm it. Here is a new funnel definition:

Here is the actual user path:
- /collections/all
- /?reverse_exit=
Note that the user’s path is in the reversed order compared to the funnel definition. The user exited the funnel at the Qualified entrance step (/?reverse_exit=). Let’s see how the visualization report paints the session:

Site exit is assigned to the Collection page step, though it happened at a step higher.
Funnel exits
When a user exits a funnel, they visit any other site URL that has not been defined in the funnel. Imagine this funnel definition:
- Cart: /cart
- Contact info: /checkout/contact_information
- Shipping info: /checkout/shipping
And here is a sample user path:
- /cart
- /checkout/contact_info
- /account/login
The last page they visited is not defined in the sample funnel. Since the last pageview hit is sent from a page not defined in the funnel, the visualization report treats that as a funnel exit. For the above scenario, the funnel exit to the login page would be assigned to the Contact info step.
The following pages are funnel exits:

In essence, site exits are funnel exits (but funnel exits are not necessarily site exits). A site exit is the last pageview hits in a user’s session. Funnel exits are not site exits because there is another pageview hit once they leave the funnel, but its URL is not defined in the funnel.
Here is how a funnel exit was recorded for my test session:

The login URL is not defined in the funnel, so it is assigned as an exit to the Contact info step. If the user path order was reversed (a visit to the Contact info is followed by Qualified entrance), the visualization report would still assign the login URL as an exit to the Contact info.
Multi-tab sessions
For Google Analytics, it does not matter if you navigate through the site using one or multiple tabs of the browser window. Your visit to the site is still treated as the same session. Because of that, you might see completely unexpected funnel exit URLs. For example, a user opens your site in multiple tabs (you might have tagged one of your internal links with target="_blank" attribute) and visits pages of your site in the following order:
- Tab 1: /
- Tab 1: /cart
- Tab 1: /checkout/contact_information
- Tab 2: /pages/faq/
Pages 2 and 3 are part of the funnel definition, while step 4 is not. The funnel visualization report will assign /pages/faq/ as a funnel exit at /checkout/contact_information. You might wonder why you see the FAQ page as an exit from the funnel if you know for sure that your funnel pages don’t have links to the FAQs page. Well, it is all because of the pageview hit sent from the second browser tab (step 4).
Loopbacks
A loopback happens when a user visits the previously visited funnel step URL or refreshes the current funnel step page. We can think of a return to the funnel step that precedes the current one as a parent loopback (think DOM):
Page 1 > Page 2 > Page 3 > Page 2

A return to the funnel step that did not immediately precede the current one could be thought of as an ancestor loopback, for example:
Page 1 > Page 2 > Page 3 > Page 1

In both cases, Page 3 will be assigned a loopback to Page 2 and Page 1, respectively. It does not matter how many steps ago the previously visited funnel step URL was, one (as in the first path) or multiple (as in the second path). The funnel visualization report does not show loopbacks. Instead, they are shown as funnel exits. Contrary to site and funnel exits, though, loopbacks are assigned to the step where they take place. The following are examples of loopbacks:

Funnel hits - the center of the report.
The funnel hits section is the last section of the funnel visualization report:

I believe it is the least helpful section of the report. Visualization reports use a feature called backfilling. The Funnel Visualization report backfills any skipped steps between the step at which the user entered the funnel and the step at which the user exited the funnel.
The above report shows the following unique pageview hits for defined funnel steps:
- Cart: 162
- Contact info: 65
- Shipping info: 36
Let’s look at a simple session, though:
- Cart - visited (+1 pageview)
- Contact info - skipped (still +1 pageview)
- Shipping info - visited (+1 pageview)
The visualization report incremented the number of pageviews for the Contact info page, even though the user never visited it. Say what?!
Let’s go back to the following pageviews:
- Cart: 162
- Contact info: 65
- Shipping info: 36
What’s the guarantee that the Contact info step indeed had 65 unique pageview hits? Most of those pageview hits could have been backfilled. What’s worse, the report will backfill any number of steps in between that were skipped, not just one.
To test this, I created two different funnels:
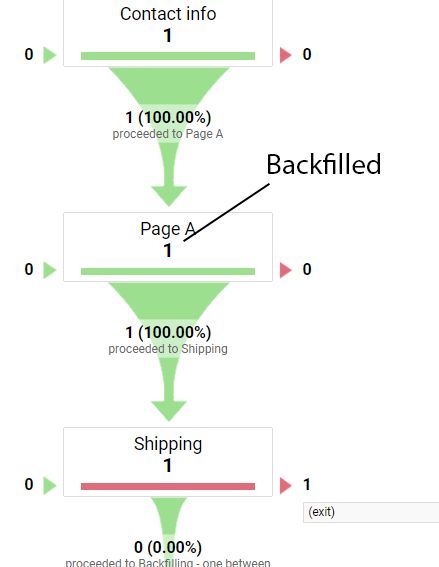
Page A was defined in the funnel, yet I did not visit it during the test session. Note that the visualization report incremented its number of unique pageviews by one. Here is another test that shows multiple steps being backfilled (pages A and B are part of the funnel, but I did not visit them):

The funnel (step) hits are useless, and I would ignore that section altogether.
Interpreting a sample Funnel Visualization Report Data
First, let’s start with a few tips to follow when trying to understand this report:
- Make sure the report you are looking at has enough data. Set the date range to at least 30 days. The funnel visualization report shows you only five exits at each step. Showing more steps would make this report too long and unpresentable. If you were to see data only for the last week or so, you are likely to see exit URLs that are more exceptions to the rule than common trends (recall that multi-tab session example we described above).
- It is crucial to be able to differentiate between two different links that take users to the same URL. For example, our users can visit the “/collections/all” page by clicking on the “All Products” menu link or the “Continue shopping” link on the Cart. It might make sense to update the “Continue shopping” link to something like “/collections/all?continue” because it would tell you which link they clicked to exit the funnel.
- Since the funnel visualization report does not support segments, it is a good idea to create filtered Views for each traffic segment you want to create a funnel. For example, desktop and mobile versions of the site might have slightly different checkout funnels with a different set of links.
Before I continue, it is worth reminding you that this report is about unique pageviews, not users. The same user can generate multiple sessions in the date range selected. The user count is 1, yet the session count is 2.
Below, I will be looking at a destination goal with the following funnel definition:

Sessions, where users reached as deep as the Cart

- 84 (exit) - site exits: eighty-four sessions ended at this step. People saw something they did not like, and there was no reason for them to continue on the site.
- 38 (/cart) - loopbacks: the Cart was refreshed 38 times. In this sample Shopify store, the Cart refreshes every time a user adds or removes a product.
- 14 (/collections) - funnel exits: 14 people clicked on a menu link to leave the funnel. It is an alternative way to continue shopping without clicking on the “Continue shopping” link.
- 8 (/collections/all?continue=) - funnel exits: people used the “Continue shopping” button that we tagged with a URL parameter to distinguish it from another link that takes users to the same page path.
- 8 (/search) - funnel exits: people used the site’s internal search feature to leave the funnel.
Sessions, where users reached as deep as the Contact Info
Since there are no steps in between the Cart and Contact info steps of our funnel, we can trust that there were around 148 continuations into the Contact info step. It would be hard to make the same assumption if there were another funnel step in between (recall the backfilling aspect).

The longer the funnel path you look at (2+ steps), the harder it is to make any factual claims because the report will assign an exit to the lowest-defined step in the user path.
- 33 (exit) - site exits. Thirty-three people left the site. There is no guarantee they left the site specifically at this step. The exit could have happened at the Cart step, too.
- 10 (/cart) - loopbacks. People clicked on the link to go back to the Cart step.
- 7 (/) - funnel exits. The funnel exit to the homepage could have happened at the Contact Info step or even the Cart step if it was on the user path. The current site I am looking at does not differentiate between the Home link of the menu and the site’s logo link that also takes them to the homepage. If the logo link to the homepage had a URL parameter (/home?logo), then I could say that the funnel exit to the homepage happened at the Contact Info page (since our Contact Info page does not have menu links). Yet, this info is a bit useless without a way to differentiate between the two links.
- 4 (/checkout/contact_information) - loopback. Four people refreshed the page at this funnel step. By looking at this sample site, this could have resulted from people incorrectly filling out their details (email, billing address, etc.). When that happens, the page is refreshed.
- 2 (/account/login?step=contact_information) - funnel exits. Fortunately, the Login link has the extra query parameter, which tells us the page the user was on when they clicked it.
Sessions, where users reached as deep as the Shipping Info

- 7 (exit) - site exits. Seven people who reached the Shipping info step left the site. They might have left the site at previous steps if those steps were on the user path.
- 4 (/checkout/contact_information) - loopbacks. Four people returned to the Contact Info step.
- 2 (/cart) - loopback. Two people returned to the Cart step.
- 1 (/account/login?step=contact_information) - funnel exit. Once again, the fact the clicked link tells us the user location at the time of the click is beneficial. Here, the funnel exit took place at the Contact Info step, not the Shipping Info step assigned by the visualization report.
- 1 (/collections/all) - funnel exit. Shipping and Contact Info steps do not have main menu links, yet the Cart does. This funnel exit actually took place at the Cart step, but it was attributed to the Shipping info because this step is the lowest in the funnel definition.
And that’s how you interpret funnel visualization reports in Google Analytics. I hope this guide serves you as the foundation for your data interpretation.


